
Clinical Researcher—April 2026 (Volume 40, Issue 2)
PEER REVIEWED
Aditi Viswanathan
The use of generative artificial intelligence (AI) in regulatory medical writing is expanding rapidly, yet the industry still lacks a standardized way to define and measure “quality.” Traditional assurance processes—multiple review layers, quality control checks, and compliance verifications—ensure accuracy but do not quantify it. Without measurable baselines, organizations cannot demonstrate whether AI-assisted drafts meet regulatory expectations or improve over time.
This article outlines an emerging, multi-layered framework for evaluating AI-generated content in regulatory submissions. It highlights post-edit distance as a practical quantitative measure of human editing effort and describes a composite Quality Index that integrates both human and automated assessments across six dimensions of quality. The goal is not to replace expert judgment, but to anchor it in measurable evidence—creating a foundation for consistent, auditable, and trustworthy use of AI in regulatory medical writing.
The Missing Metric in Regulatory Writing
Regulatory medical writing is a specialized discipline central to clinical development. Writers in this field translate complex clinical data into documents that support regulatory submissions, including clinical study reports, investigator brochures, and summary documents required for marketing authorization. The work demands scientific rigor, strict adherence to international regulatory standards, and precision in language. A single clinical study report can span hundreds of pages, integrating statistical outputs, safety narratives, and efficacy conclusions that regulators scrutinize before approving a new therapy.
The structure and expectations for these documents are well established. The International Council for Harmonization (ICH) E3 guideline, first published in 1995, remains the foundational reference for the format and content of clinical study reports.{1} More recent efforts, such as the Clarity and Openness in Reporting: E3-based (CORE) Reference, have sought to modernize reporting practices in response to evolving transparency requirements.{2} Together, these frameworks define what information regulatory documents must contain and how that information should be organized. What they do not define is how the quality of the writing itself should be measured.
For decades, regulatory medical writing has operated as a highly professional craft without a standardized, quantitative approach to quality measurement. Accuracy, compliance, and clarity are widely recognized as essential attributes, yet the field lacks a common method to assess them in measurable terms. Quality is maintained through layered review processes—author self-checks, independent quality control, senior scientific review, and final approval—but success is typically binary.{3} A document either passes review or it does not. Once approved, it is deemed “high quality,” with little objective basis for comparison across documents, teams, or time.
The absence of formal quality metrics mattered less when regulatory text was entirely human-authored. The emergence of generative artificial intelligence has changed this context. AI systems can now generate substantial portions of regulatory documents, and pharmaceutical sponsors are actively exploring these capabilities to accelerate drafting and reduce manual effort.{4}
Industry analyses and early deployments suggest that AI-assisted tools can compress first-draft timelines from weeks to days.{5,6} As these systems move from experimentation to routine use, organizations are increasingly confronted with a practical question: How can the quality of AI-generated regulatory content be evaluated and demonstrated in a way that satisfies scientific, regulatory, and organizational expectations?
In regulated environments, subjective confidence is insufficient. Traditional quality assurance processes are designed to prevent errors, not to quantify quality itself. Metrics such as turnaround time or the number of review cycles provide insight into efficiency, but they offer little visibility into the integrity, clarity, or regulatory robustness of the underlying content.{7} Without objective measurement, organizations lack a baseline against which improvement can be assessed or claims about AI-enabled gains can be substantiated.{8,9}
Effective integration of AI into regulatory writing therefore begins with measurement. Organizations must establish consistent, quantitative criteria for key dimensions of quality, including accuracy, compliance, and clarity. Once those criteria are defined, assurance processes can be structured to monitor performance against them. Measurement establishes the target; assurance ensures it is met.
A Quantitative Anchor: Post-Edit Distance
A practical way to measure quality is to determine how much editing an AI-generated draft requires to reach approval. Post-edit distance (PED) quantifies that effort as the proportion of text modified between the AI’s initial draft and the final approved version. A low PED reflects minimal revision; a high PED, extensive rewriting. Because PED measures content changes rather than editing time, it enables consistent comparison across writers and projects.
In domains such as machine translation, edit-based metrics have long been used to quantify how much human revision a system’s output requires. While the context and error types differ, the underlying principle carries over: measuring how much text must change to reach an acceptable standard.
Applied to regulatory writing, PED offers an empirical gauge of how closely AI-generated text meets defined quality expectations. PED does not distinguish between factual, stylistic, or structural edits; a high score may reflect substantive corrections or simply differences in phrasing preference.
As a preliminary indicator rather than a definitive measure, PED is most useful when tracked over time and interpreted alongside other metrics. This allows organizations to assess whether drafts are approaching acceptable standards with less revision effort.
Building a Layered Evaluation Framework
No single metric can fully capture the quality of regulatory documents. The evaluation approach we propose is deliberately layered, reflecting the structure outlined in the original Peer AI whitepaper (see Figure 1). Each layer examines a different dimension of quality. Together they form a coherent system that balances expert judgment, quantitative evidence, and automated consistency checks.{10}
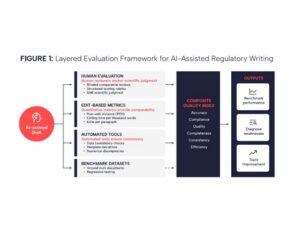
Layered evaluation framework illustrating how human review, quantitative metrics, automated checks, and benchmark datasets work together to assess the quality of AI-generated regulatory documents. Each layer evaluates a distinct dimension of quality, with human judgment anchoring the overall assessment.
Human evaluation anchors the framework. Blinded comparative reviews place AI and human-written sections side by side, allowing subject matter experts to judge equivalence on scientific grounds. Structured rubrics convert that judgment into data by scoring accuracy, clarity, compliance, and interpretation using predefined severity scales. These evaluations capture nuance and ensure that scientific reasoning remains central.
Edit- and efficiency-based metrics form the next layer. PED quantifies how much of the AI-generated draft must change to reach approval. Additional measures, such as editing time per thousand words, or edits per paragraph reveal whether AI assistance reduces effort without sacrificing accuracy. These metrics provide the quantitative spine of the framework.
Automated evaluation tools extend the framework’s reach. Large language models configured purely for review can flag inconsistencies, missing or misaligned data, template deviations, and numerical discrepancies at scale. Under such oversight, these checks deliver consistency and breadth, but they do not replace human review.
Benchmark datasets serve as the foundation. Curated gold-standard documents create a stable reference for testing AI systems under consistent conditions. They support regression testing, highlight shifts in model behavior, and enable meaningful comparison over time and across teams.
Together, these layers create an integrated evaluation architecture. Human reviewers support scientific judgement, quantitative metrics provide comparability, automated tools ensure consistency, and benchmarks deliver stability. The strength of the system is in the interaction of the layers, with each compensating for the limitations of the others, and together enabling a level of rigor appropriate for regulated environments.
Why Standard NLP Metrics Fall Short
Standard Natural Language Processing (NLP) metrics such as Bilingual Evaluation Understudy (BLEU), Recall-Oriented Understudy for Gisting Evaluation, (ROUGE) and Cross-lingual Optimized Metric for Evaluation of Translation (COMET) were developed for translation and summarization tasks, where the goal is to compare a model’s output against a reference text. While these metrics can indicate whether an output resembles a reference linguistically, they do not assess the qualities that matter in regulatory medical writing: factual accuracy, numerical concordance with source data, adherence to regulatory templates, and correct interpretation of study results.{11}
Two passages may differ in wording yet both can be correct, or appear similar while diverging from the underlying data. In regulated contexts where precision, traceability, and compliance take precedence over surface similarity, these general-purpose metrics provide an incomplete and often misleading signal of quality. These limitations become critical in regulated contexts, where content must be assessed for factual accuracy, logical coherence, and adherence to guidance such as the aforementioned ICH E3 guideline, rather than for textual similarity.
A highly accurate document might receive a low BLEU score simply for using alternate phrasing, while a fluent but factually incorrect passage could score high. Therefore, domain-specific evaluation metrics anchored in source data and document structure are necessary for assessing the true quality of AI-generated regulatory text.
From Framework to Standard
To integrate the different evaluation methods, an emerging approach introduces a composite Quality Index that aggregates results across six dimensions (see Table 1).
Table 1: Quality Index Dimensions and Weights
| Dimension | Definition | Measurement Method | Weight |
| Accuracy | Factual and numerical concordance with source data | Automated data checks; human verification of key data, figures and interpretations | 25% |
| Compliance | Adherence to regulatory guidance and template requirements | Checklist verification against ICH E3 and sponsor templates | 25% |
| Clarity | Readability and coherence | Structured rubric scoring by reviewers; readability metrics | 15% |
| Consistency | Alignment of terminology, abbreviations, and International System of Units use throughout | Automated cross-reference checks; terminology audits | 10% |
| Completeness | Inclusion and traceability of all required information | Section-by-section verification against source documents | 15% |
| Efficiency | Human effort required to finalize text | Similarity score derived from PED; editing time per section Similarity score = 100×(1−PED/max(∣s1∣,∣s2∣)) |
10% |
Dimensions of the composite Quality Index, including definitions, measurement approaches, and relative weighting used to evaluate the quality of AI-generated regulatory content. Note: Organizations may adjust these weights to reflect their priorities, provided the rationale is documented and applied consistently.
Each dimension is rated on a 0–100 scale using objective data checks and structured rubrics, with accuracy and compliance weighted most heavily. The composite index, averaged across sections or entire documents, enables organizations to benchmark performance, diagnose weaknesses, and track improvement over time.
In the composite calculation, accuracy and compliance each carry 25% weight, clarity and completeness 15% each, and consistency and efficiency 10% each. Organizations may adjust these weights to reflect their priorities, provided the rationale is documented and applied consistently.
Successful implementation depends as much on governance and calibration as on mathematics. Reviewers enhance reproducibility by aligning severity definitions and periodically double-scoring samples. A confidence rating indicates the extent of supporting evidence, clarifying whether all dimensions were assessed.
Adoption can proceed incrementally—from initial tracking of accuracy and compliance to the inclusion of additional measures—provided that organizations begin capturing structured quality data to establish meaningful benchmarks and long-term trends.
Putting it All Together
Example 1 in Figure 2 illustrates how PED and the composite Quality Index can be applied to a specific regulatory document section to identify discrete quality gaps.
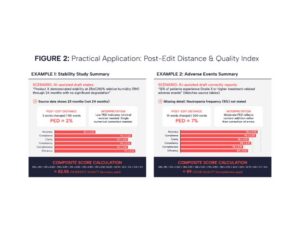
Example application of the composite Quality Index to an AI-assisted stability summary in Module 3 of the Common Technical Document. The figure illustrates how PED and dimension-level scores contribute to an overall quality assessment, highlighting how discrete accuracy issues can be identified despite low overall revision effort.
Consider a stability study summary produced with AI assistance. The initial draft states: “Product X demonstrated stability at 25°C/60% relative humidity (RH) through 24 months with no significant degradation.” Review against the source data reveals that the study ran 23 months, not 24. Correcting this changes 1 character in a 117-character passage, yielding a PED of 0.85%. The low PED indicates minimal revision was needed (single character correction needed). Applying the Quality Index, scores are assigned across six dimensions: accuracy 50 (numerical discrepancy), compliance 95, clarity 90, consistency 94, completeness 90, and efficiency 96. The composite score weights accuracy and compliance most heavily:
Composite Quality Index =
(50 × 0.25) + (95 × 0.25) + (90 × 0.15) + (94 × 0.10) + (90 × 0.15) + (96 × 0.10) = 82.25
The result reflects a moderate-quality draft with one discrete accuracy gap for which a high penalty is applied. Tracking errors of this type allows teams to refine their processes and address recurring weaknesses systematically.
Implementation Considerations
Translating these evaluation results into routine practice requires careful implementation. Generative AI reflects what it receives. Incomplete source materials or narrowly framed prompts can introduce bias into the resulting text, often subtly. Countering this requires clear prompting protocols, representative source data, and review steps that surface skewed interpretations.
Subject matter experts must remain engaged at key decision points. No automated check substitutes for a human reviewer who can recognize when a draft has drifted from scientific intent or regulatory expectation.
Implications for Regulatory Trust
Measuring quality in regulatory writing is less about scoring AI systems than about ensuring trust in how scientific results are communicated. Regulators, sponsors, and investigators must have assurance that AI-assisted documents meet the same standards of accuracy and transparency as human-authored submissions. Quantitative evaluation turns that assurance into verifiable evidence.
As generative AI tools advance, shared standards for evaluating their output will become as essential as the quality frameworks that matured in manufacturing and clinical operations. Consistent definitions, standardized measures, and transparent scoring criteria will allow meaningful comparison across systems and foster trust among reviewers.
The question is no longer whether AI can assist in regulatory writing, but whether it can do so reliably and verifiably. A structured, data-driven framework for quality evaluation provides the evidence base to answer that question—and to guide the accountable use of AI across the regulatory landscape.
Conclusion
The integration of generative AI into regulatory medical writing is no longer a theoretical prospect. Organizations are already using these tools to draft clinical documents, and the pace of adoption continues to accelerate. Yet the field still lacks a standardized way to evaluate whether AI-assisted output meets the rigorous standards that regulators, sponsors, and investigators expect. This gap must be addressed.
The framework outlined in this article offers a path forward. Post-edit distance provides a practical, quantifiable measure of how much human revision an AI-generated draft requires before approval. The composite Quality Index extends this foundation by integrating scores across six dimensions: accuracy, compliance, clarity, consistency, completeness, and efficiency, anchored by human judgment and supported by automated checks. Together, these tools allow organizations to benchmark performance, identify weaknesses, and track improvement over time.
Measurement alone is not the goal. The purpose is to establish a basis for trust. Regulators reviewing AI-assisted submissions need confidence that quality has been verified, not assumed. Sponsors need evidence that efficiency gains have not come at the cost of accuracy. Writers and reviewers need a shared vocabulary for evaluating output.
Quantitative standards, applied consistently and transparently, provide that common ground and form the basis for trust. As these tools continue to advance, the industry must develop evaluation frameworks that keep pace.
The approach proposed here is a starting point, not a final answer. What matters now is that organizations begin capturing structured quality data, testing these methods in practice, and refining them through experience. Measurement creates the target. The work of building trust begins with the decision to measure.
References
- International Council for Harmonization. 1995. ICH E3: Structure and Content of Clinical Study Reports. https://database.ich.org/sites/default/files/E3_Guideline.pdf
- Hamilton S, Bernstein AB, Blakey G, et al. 2016. Developing the Clarity and Openness in Reporting: E3-based (CORE) Reference user manual for creation of clinical study reports in the era of clinical trial transparency. Res Integr Peer Rev 1:4. doi:10.1186/s41073-016-0009-4
- Quanticate. 2018. What Defines Quality in Medical Writing? https://www.quanticate.com/blog/quality-in-medical-writing
- Ramachandran R, Linenbach T, Ceppi C, Modi A. 2024. Reimagining Clinical and Regulatory Medical Writing With Generative AI. AMWA Journal 39(2).
- McKinsey & Company. 2024. Generative AI in the pharmaceutical industry: Moving from hype to reality. https://www.mckinsey.com/industries/life-sciences/our-insights/generative-ai-in-the-pharmaceutical-industry-moving-from-hype-to-reality
- Merck. 2025. Merck Expands Innovative Internal Generative AI Solutions Helping to Deliver Medicines to Patients Faster [press release]. https://www.merck.com/news/merck-expands-innovative-internal-generative-ai-solutions-helping-to-deliver-medicines-to-patients-faster/
- American Medical Writers Association. 2023. The Importance of Quality Control in Medical Writing. https://blog.amwa.org/the-importance-of-quality-control-in-medical-writing
- American Medical Writers Association. 2022. Do you measure up? Measuring quality in medical writing. https://amwa.org/blog
- Trilogy Writing & Consulting. 2021. Do you measure up? Quality metrics in medical writing. https://trilogywriting.com/resources/do-you-measure-up-quality-metrics-in-medical-writing
- Vamvas J, Rei R, Specia L. 2025. Evaluating generative AI with human- and model-based judgment frameworks. Frontiers in Artificial Intelligence 8(102317). https://doi.org/10.3389/frai.2025.102317
- Strömbergsson S, Ljubešić N, van der Lee C, Rehm G. 2024. Evaluating factual accuracy in AI-generated text: A comparison of automatic metrics and human judgment. Proceedings of the 2024 Language Resources and Evaluation Conference (LREC 2024). European Language Resources Association.

Aditi Viswanathan is Head of Engineering at Peer AI, based in San Francisco. She has also served as Chief Technology Officer for allofus.ai, as a Software Engineer for Google and the Innovation Labs of [24]7.ai, and as a Data Engineer for Noodle.ai.