Clinical Researcher—February 2025 (Volume 39, Issue 1)
PEER REVIEWED
Grace Parrish, MS; Laurie A. Minns, PhD
Clinical research associates (CRAs) are essential for monitoring clinical trials and managing relationships between sponsors and clinical investigative sites. Previous studies suggest factors associated with high turnover among CRAs include financial compensation, workload, career development, and management, yet data are in short supply regarding factors influencing turnover post-COVID-19.
We used a cross-sectional survey design to investigate the factors contributing to turnover intentions among CRAs within contract research organizations (CROs). Participants were recruited through social media networks (LinkedIn and Facebook) and via e-mail between January 29 and February 25, 2024 to complete a 36-question survey that included demographic, financial compensation, perceived workload, career development, management, and turnover intention questions (see Appendix A). A negative correlation was confirmed for all factors compared to turnover intention.
The results from this study can be used to educate on factors associated with turnover intention in CRAs and help CRO leaders determine solutions to improve employee satisfaction among CRAs and reduce turnover.
Background
Some facts and figures to keep in mind as we go forward include:
- CRAs serve as a liaison between sponsors and sites with the responsibility of evaluating potential sites, providing training to site staff, reviewing facilities, reviewing the quality of patient data, reviewing regulatory documents, and more.{1,2}
- This demanding environment can lead to emotional exhaustion and burnout in employees, resulting in increased turnover rates. CRA turnover increased by four percentage points in just one year from 2020 to 2021 (to 28%), and was 32% in 2022.{3–7}
- During the COVID-19 pandemic, there was a decrease in the number of non-COVID-19 trials, but the number of total trials initiated increased in 2020 compared to 2019.{8} The strategy for clinical trials within this time was adapted to produce results in a rapid timeframe.{9,10} These trials were also directed toward decentralization to allow participation while limiting the spread of COVID-19.{10} In light of the pandemic, the increased pace of clinical trials and the need to address the public health emergency likely contributed to the increase in CRA turnover.
In the post-pandemic period, it is important to understand the factors that contribute to high CRA turnover, since losing well-trained CRAs can lead to increased costs and reduced productivity for CROs and sponsors. Optimal turnover level to limit productivity impacts in any industry is roughly 9%.{11}
Previous studies highlight the roles of salary, workload, lack of career development, and management as important factors in CRA turnover,{5–7} yet the role of these factors in the post-pandemic CRA role is not well understood. Emotional exhaustion from unmanageable workload was positively correlated with turnover intentions.{12} Remote monitoring, “lightspeed” clinical trials, and travel days likely contributed to job exhaustion.{9,10,13} Lack of training and clear development opportunities are also associated with turnover.{14,15}
The Knowledge Gap: Factors Influencing CRA Turnover in the Post-Pandemic Workplace
Since the COVID-19 pandemic, relationships between salary, workload, career development opportunities, and interactions with management are likely to influence CRA turnover. Since COVID-19 changed the clinical research landscape so drastically and so quickly, and since personal priorities regarding employment opportunities and work/life balance likely also changed within such a short time frame, we expect the factors that influence CRA turnover will be different in pre-pandemic and pandemic periods. By identifying these factors, CROs will be able to implement changes needed to address these to reduce CRA turnover.
The independent variables evaluated will be financial compensation, perceived workload, career development, and management. The dependent variable will be turnover intention. The hypothesis to be tested is that financial compensation and workload will be the largest contributors for turnover intentions for CRAs at CROs.
Methods
The study utilized a cross-sectional survey completed by CRAs employed by CROs globally. The study was reviewed and declared exempt by the University of North Carolina Wilmington (UNCW) Institutional Review Board on December 7, 2023, under study # H24-0394.
Participants
The study population included 273 participants. The required sample size was calculated using the Qualtrics sample size calculator with the confidence interval set to 95%, population size set to 5,000, and the margin of error set to 5%. The ideal sample size generated was 357.
Participants were recruited to complete a survey through social media networks from groups on various platforms that included clinical research professionals employed by such companies as ICON plc, PPD, Pfizer, and PRA Health Sciences with snowball recruitment (LinkedIn and Facebook) and via e-mail from UNCW between January 29, 2024, and February 25, 2024. Initial posts were made on social media networks followed by additional posts every one to two weeks to maximize potential participants reached.
By completing the survey, participants agreed to informed consent. All data collected in the survey were anonymized. The inclusion criteria were that the participant had to be 18 years or older and that the participant had to be a currently employed CRA at a CRO. Participants who did not meet inclusion criteria or did not complete enough of the survey to determine eligibility were deemed a screen fail and excluded from data analysis. Participants received no compensation for completing the survey.
The Survey
The 36-question survey was modified from previously published studies on retention and turnover and deployed through Qualtrics.{6,16} A pilot study of 16 volunteers identified potential errors in the survey.
Participant locations were divided into United States and International. Those located in the United States were divided further as regions based on the U.S. Census Bureau.{16}
Likert-style questions included both positively worded questions and reverse forms to prevent potential response bias. These questions were rated on a 5-point scale as follows: (1) Strongly agree, (2) Agree, (3) Neither agree nor disagree, (4) Disagree, and (5) Strongly disagree.
Four questions (14, 19, 20, and 22) were reverse scored. A summary score was determined by adding scores for all questions in each section (with reverse questions receiving a reversed score).
Data Analysis
Participants who did not turn in a complete set of survey responses were only included in the analysis of demographic data. A complete response was defined as answering at least 90% of the survey questions.
Descriptive statistics were conducted on demographic data. To determine the correlation between each independent variable (financial compensation, perceived workload, career development, and management) with the dependent variable (turnover intention), a bivariate regression and linear fit was completed using JMP Pro 17 Statistical software. The correlation coefficient, p-value, and R-Square values were calculated to determine statistical significance.
Results
Demographics
As shown in Figure 1, a total of 273 participants initiated the survey and consented. Eighty-nine participants were considered screen fails and were excluded from analysis. Twenty-seven participants completed less than 90% of the survey and were only included in the data analysis of the demographics. One hundred fifty-seven participants completed the survey and were included in the final analysis sample.
Figure 1: Flowchart of Surveys Initiated and Completed

Participant demographics (see Table 1) showed the mean age of participants was nearly 40 years (N=184), almost 83% of participants identified as women, and 79% of participants identified as White/Caucasian. With regard to the highest level of education, nearly 53% reported a bachelor’s degree and a little more than 34% reported a graduate degree.
Table 1: Summary of Participant Demographic Characteristics
| Age | Sample size | Percentage |
| 21-30 | 44 | 23.91% |
| 31-40 | 62 | 33.70% |
| 41-50 | 46 | 25.00% |
| 51-60 | 24 | 13.04% |
| 61-70 | 7 | 3.80% |
| 70+ | 1 | 0.54% |
| Gender | ||
| Man | 33 | 9.35% |
| Woman | 146 | 82.72% |
| Non-Binary | 1 | 1.13% |
| Prefer not to say | 4 | 6.80% |
| Race/Ethnicity | ||
| American Indian or Alaskan | 3 | 0.29% |
| Asian/Pacific Islander | 13 | 3.75% |
| Black or African American | 10 | 3.84% |
| Hispanic | 7 | 3.36% |
| White/Caucasian | 137 | 78.96% |
| Other | 2 | 1.34% |
| Prefer not to say | 11 | 8.45% |
| Not Answered | 1 | |
| Highest Level of Education | ||
| High School or GED | 4 | 2.17% |
| Associate degree | 11 | 5.98% |
| Bachelor’s degree | 97 | 52.72% |
| Graduate degree | 63 | 34.24% |
| Not Answered | 9 | 4.89% |
| Work Effort | ||
| Full-Time | 174 | 94.57% |
| Not Answered | 10 | 5.43% |
| Previous Research Experience (Years) Prior to Becoming a CRA | ||
| ≤1 | 47 | 25.54% |
| 2 | 28 | 15.22% |
| 3 | 14 | 7.61% |
| 4 | 16 | 8.70% |
| 5 | 15 | 8.15% |
| 6 | 11 | 5.98% |
| 7 | 8 | 4.35% |
| 8 | 4 | 2.17% |
| 9 | 4 | 2.17% |
| >10 | 28 | 15.22% |
| Not Answered | 9 | 4.89% |
| Experience (Years) as a CRA | ||
| ≤1 | 14 | 7.61% |
| 2 | 36 | 19.57% |
| 3 | 25 | 13.59% |
| 4 | 13 | 7.07% |
| 5 | 12 | 6.52% |
| 6 | 4 | 2.17% |
| 7 | 8 | 4.35% |
| 8 | 23 | 12.50% |
| 9 | 7 | 3.80% |
| >10 | 33 | 17.93% |
| Not Answered | 9 | 4.89% |
| Annual Monetary Compensation (Including Any Bonus Pay)* | ||
| Mean: $123,462.36 | 80 | |
| *28 international respondents were excluded from this portion of the analysis | ||
Of the participants who reported on work effort, 100% reported it as full-time. The mean amount of experience prior to becoming a CRA was 4.3 years; however, 25.5% reported having one year or less of clinical research experience prior to becoming a CRA. The mean amount of experience as a CRA was 5.3 years. The mean annual monetary compensation was $123,462.36 (N=80).
Of the 184 participants included in this analysis, 76.1% of participants were in the U.S., 16.8% were located outside the U.S., and 7.1% did not answer (see Table 2). Of the participants in the U.S., 45.1% were in states in the south region.
Table 2: Location Summary
| U.S. | N | % of Total | International | N | % of Total | |||||
| Regions | Northeast | 24 | 15.69% | Countries | Australia | 2 | 4.55% | |||
| Midwest | 28 | 18.30% | Bulgaria | 2 | 4.55% | |||||
| South | 69 | 45.10% | Canada | 5 | 11.36% | |||||
| West | 19 | 12.42% | France | 1 | 2.27% | |||||
| Not Answered | 13 | 8.50% | Germany | 1 | 2.27% | |||||
| States | Arizona | 6 | 3.92% | Greece | 2 | 4.55% | ||||
| Arkansas | 1 | 0.65% | Italy | 1 | 2.27% | |||||
| California | 5 | 3.27% | Latvia | 1 | 2.27% | |||||
| Colorado | 1 | 0.65% | Mexico | 1 | 2.27% | |||||
| Connecticut | 1 | 0.65% | New Zealand | 1 | 2.27% | |||||
| D.C. | 1 | 0.65% | Norway | 1 | 2.27% | |||||
| Florida | 9 | 5.88% | Pakistan | 1 | 2.27% | |||||
| Georgia | 2 | 1.31% | Poland | 3 | 6.82% | |||||
| Idaho | 1 | 0.65% | Slovakia | 1 | 2.27% | |||||
| Illinois | 6 | 3.92% | South Africa | 2 | 4.55% | |||||
| Indiana | 2 | 1.31% | Sweden | 1 | 2.27% | |||||
| Kansas | 1 | 0.65% | Taiwan | 1 | 2.27% | |||||
| Kentucky | 1 | 0.65% | U.K. | 4 | 9.09% | |||||
| Louisiana | 1 | 0.65% | Not Answered | 13 | 29.55% | |||||
| Massachusetts | 1 | 0.65% | ||||||||
| Michigan | 4 | 2.61% | ||||||||
| Minnesota | 1 | 0.65% | ||||||||
| Missouri | 5 | 3.27% | ||||||||
| Montana | 1 | 0.65% | ||||||||
| Nebraska | 2 | 1.31% | ||||||||
| Nevada | 1 | 0.65% | ||||||||
| New Jersey | 4 | 2.61% | ||||||||
| New York | 7 | 4.58% | ||||||||
| North Carolina | 36 | 23.53% | ||||||||
| Ohio | 8 | 5.23% | ||||||||
| Pennsylvania | 10 | 6.54% | ||||||||
| South Carolina | 5 | 3.27% | ||||||||
| Tennessee | 7 | 4.58% | ||||||||
| Texas | 6 | 3.92% | ||||||||
| Virginia | 1 | 0.65% | ||||||||
| Washington | 3 | 1.96% | ||||||||
Financial Compensation
The distribution of annual monetary compensation by experience level shows the mean salary of CRAs with one year or less of experience is $83,323 and $137,993 for CRAs with 10 or more years of experience (see Figure 2). The mean salary of CRAs with one year or less of clinical research experience prior to becoming a CRA is $107,273 and $128,240 for CRAs with 10 or more years of experience.
The mean financial compensation summary score was 17.85 (out of a possible high score of 30, with as many as 5 points for each response in questions 12 to 17) (see Figure 3).
Responses around financial compensation were variable. For example, in response to question 13 (I feel my work is compensated), 49% agreed and 28% disagreed with the statement. Figure 4 shows the distribution of responses to question 12 (I feel my salary is adequate to the industry standard) with CRA reported salaries. The mean salary was $136,833 for those who reported “strongly agree,” $131,170 for “agree,” $115,813 for “neither agree nor disagree,” $102,618 for “disagree,” and $110,688 for “strongly disagree.”
Figure 2: Annual Monetary Compensation by Experience as a CRA and Previous Research Experience Prior to Becoming a CRA
[Distribution of experience (in years) as a CRA is depicted on the left. Distribution of experience (in years) of previous research experience prior to becoming a CRA is depicted on the right. Those who reported one year or less are represented by the <1 category. Those who reported 10 or more years are represented by the 10< category. Reported annual compensation included any bonus pay.]
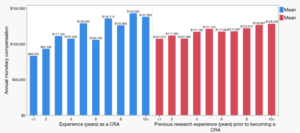
Figure 3: Responses to Financial Compensation Questions (12 to 17)

Figure 4: Annual Monetary Compensation by Question 12 (I Feel My Salary is Adequate to the Industry Standard)

Perceived Workload
The mean perceived workload summary score was 15.41 (out of a possible high score of 25 derived from 5 points maximum for questions 18 to 22) (see Figure 5). Most respondents found workloads to be manageable (question 21), with 49% reporting that they agreed, 19% neither agreed nor disagreed, 24% disagreed, and 5% strongly disagreed with the statement.
Competing job pressures appeared to limit the ability of participants to do their best (question 22: Pressures from my job limit me from doing my job to the best of my ability), as 6% of participants strongly agreed, 31% agreed, 17% neither agreed nor disagreed, 33% disagreed, and 13% strongly disagreed with the statement.
Figure 5: Responses to Perceived Workload Questions (18 to 22)

Career Development
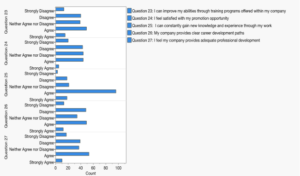
The mean career development summary score was 14.42 (out of a possible maximum of 25; 5 points maximum each for questions 23 to 27) (see Figure 6). Respondents generally reported gaining new knowledge and experiences through work (question 25), with 62% of respondents agreeing with the statement. The other questions about career development opportunities were variable (Figure 6).
Figure 6: Responses to Career Development Questions (23 to 27)
Management
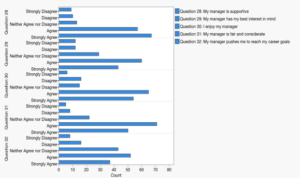
The mean management summary score was 10.74 (out of a possible maximum of 25; 5 points maximum each for questions 28 to 32) (see Figure 7). Participants reported supportive managers (37% agreed, 43% strongly agreed), the manager has the employee’s best interests in mind (38% agreed, 28% strongly agreed), the employee enjoys the manager (42% agreed, 35% strongly agreed), and the manager is fair and considerate (46% agreed, 32% strongly agreed).
For the last question (My manager pushes me to reach my career goals), 24% of participants strongly agreed, 33% agreed, 28% neither agreed nor disagreed, 10% disagreed, and 5% strongly disagreed with the statement.
Figure 7: Responses to Management Questions (28 to 32)
Turnover Intention
The mean turnover intention summary score was 12.09 out of a maximum of 25 points for responses to questions 33 to 35 (see Figure 8). Questions regarding turnover were variable with no clear trend. A bivariate fit analysis between reported turnover intention and financial compensation showed a correlation coefficient of -0.624, a p-value of <.0001, and an R-squared value of 0.389 (see Figure 9). The regression between reported turnover intention and perceived workload showed a correlation coefficient of -0.612, a p-value of <.0001, and an R-squared value of 0.374. The regression between reported turnover intention and career development showed a correlation coefficient of -0.596, a p-value of <.0001, and an R-squared value of 0.355. The regression between reported turnover intention and management showed a correlation coefficient of -0.609, a p-value of <.0001, and an R-squared value of 0.371. Financial compensation, perceived workload, career development, and management summary significantly contributed to intended turnover in CRAs working in post-COVID-19 pandemic conditions.
Figure 8: Responses to Turnover Intention Questions (33 to 36)

Figure 9: Bivariate Fit of Turnover Intention by Financial Compensation (A), Perceived Workload (B), Career Development (C), and Management (D)

Discussion
Financial compensation, perceived workload, career development factors, and management were significantly correlated to employee turnover intention between January and February 2024, supporting the hypothesis of this study. The strongest correlations were for financial compensation and perceived workload. These responses are consistent with previous studies focused on CRA turnover prior to and during the COVID-19 pandemic.{5,6,9,12,14,16,17}
We expected perceived workload to be a high contributing factor based on post-pandemic changes to the clinical research landscape, and to changes in post-pandemic workplaces in general. A supportive work-life culture (including family-supportive supervisor behaviors) influences employee satisfaction post-pandemic.{18} The pandemic brought longer workdays and lower supervisor/management interactions across all industries,{19} though it is unclear still whether these longer workdays and management changes persist in the post-pandemic workplace. Data from this study suggest CRAs continue to feel the effects of a rapidly changing industry in light of the COVID-19 pandemic.
Interestingly, there appeared to be a minimum salary where turnover intention was lower. A mean salary of $131,170 was the threshold salary where participants felt they were appropriately compensated; however, with a mean salary of $115,813, participants neither agreed or disagreed that they felt this way.
Considering the cost to onboard new CRAs, CROs would be better positioned to attempt to retain CRAs in their current role. Although the true cost to perform a job search and hire replacements is company specific, replacing CRA positions can lead to slower timelines and missed deliverables for CROs. Increasing the salary for CRAs through bonuses or a raise may be a beneficial strategy to reduce turnover.
There was not much difference in salary based on previous research experience prior to becoming a CRA; however, there was a difference in salary based on the experience as a CRA. With each year of experience, the mean salary increased by at least $9,000 until reaching five years of experience. After five years, the mean salary does not seem to increase much between five and 10 or more years. This supports reports that CRAs have a 22-month shorter tenure compared to other CRO employees within CROs in 2022, and that the reported annualized total cash increase for CRAs was 2% to 3.2% a year over 10 years.{3,4} As the expectation is a 10% increase in pay when switching companies, this short tenure for CRAs is possibly due to the low annual percentage increases experienced when remaining at their current company.
Perceived workload and career development opportunities were both significantly related to employee turnover. There were many opportunities to improve in areas such as increasing skill sets through training, promotion opportunities, clear career development paths, and professional opportunities. These findings suggest the implementation of continuing education, mentoring programs, and professionalization support would support efforts to alleviate these barriers.{17}
Implementing career development tools, such as career paths, and providing employees with mentorship or continued education can keep employees engaged and limit turnover intentions. Many CRAs reported having a supportive manager, but may not feel their manager is pushing them to reach their career goals or has their best interest in mind. Managers should ensure CRAs are familiar with the career development opportunities available to them through their company.
Importantly, the majority of CRAs reported they consider leaving their current company often. Many CRAs reported they constantly want to quit their job, and many will try to look for a job within the next year. This is consistent with the high turnover rates for this position and the low tenure for this role among CROs.{3,4}
The independent variables evaluated (financial compensation, perceived workload, career development, and management) all had a negative correlation to turnover intention. The findings from this study can help provide an understanding of the high turnover of CRAs at CROs to help these organizations develop solutions to reduce turnover.
References
- Clinical Research Associate. Talentmark: The Life in Science. https://www.talentmark.com/clinical-research-associate/
- Walters L. 2023. What does a clinical research associate do? https://www.pharmiweb.jobs/article/what-does-a-clinical-research-associate-cra-do-
- Canavan J, Bradley K. 2024. 2023/2024 Clinical Research Organization Compensation and Turnover Insights Report. BDO. https://www.bdo.com/insights/tax/2023-2024-clinical-research-organization-compensation-turnover-insights-report
- Canavan J, Bradley K. 2023. 2022/2023 Clinical Research Organization Compensation and Turnover Insights Report. BDO. https://www.bdo.com/insights/tax/2022-2023-clinical-research-organization-compensation-turnover-insights-report
- Heyns MM, McCallaghan S, de Wet EH. 2022. The role of supervisor support and basic psychological needs in predicting work engagement, burnout and turnover intentions in a medical contract research service setting. Res Social Adm Pharm 18(6):2981–8.
- Pickle EEO, et al. 2017. The Clinical Research Associate Retention Study: A Report From the Children’s Oncology Group. J Pediatr Oncol Nurs 34(6):414–21. https://pubmed.ncbi.nlm.nih.gov/28836478/
- Willard-Grace R, et al. 2019. Burnout and Health Care Workforce Turnover. Ann Fam Med 17(1):36–41.
- Lasch F, et al. 2022. The Impact of COVID-19 on the Initiation of Clinical Trials in Europe and the United States. Clin Pharmacol Ther 111(5):1093–1102.
- Anderson AS. 2022. A lightspeed approach to pandemic drug development. Nat Med 28(8):1538.
- FDA.gov. 2023. The Evolving Role of Decentralized Clinical Trials and Digital Health Technologies. https://www.fda.gov/drugs/cder-conversations/evolving-role-decentralized-clinical-trials-and-digital-health-technologies
- De Winne S, et al. 2019. The impact of employee turnover and turnover volatility on labor productivity: a flexible non-linear approach. The International Journal of Human Resource Management 30(21):3049–79.
- Kim N, et al. 2020. The Crossover Effects of Supervisors’ Workaholism on Subordinates’ Turnover Intention: The Mediating Role of Two Types of Job Demands and Emotional Exhaustion. Int J Environ Res Public Health 17(21).
- Mäkelä L, et al. 2021. International business travelers’ job exhaustion: effects of travel days spent in short-haul and long-haul destinations and the moderating role of leader-member exchange. Journal of Global Mobility 9(3):434–55.
- Knapke JM, et al. 2022. Issues for recruitment and retention of clinical research professionals at academic medical centers: Part 1 – collaborative conversations Un-Meeting findings J Clin Transl Sci 6(1):e80.
- Henderson L. 2022. Salary Survey: The Age of Covid. Applied Clinical Trials 31(1/2).
- Lee X, Yang B, Li W. 2017. The influence factors of job satisfaction and its relationship with turnover intention: Taking early-career employees as an example. Anales de Psicología 33(3):697–707.
- Knapke JM, et al. 2022. Academic medical center clinical research professional workforce: Part 2 – Issues in staff onboarding and professional development. J Clin Transl Sci 6(1):e81.
- Chan XW, et al. 2023. Work, life and COVID-19: a rapid review and practical recommendations for the post-pandemic workplace. Asia Pacific Journal of Human Resources 61(2):257–76.
- McPhail R, et al. 2024. Post-COVID remote working and its impact on people, productivity, and the planet: an exploratory scoping review. The International Journal of Human Resource Management 35(1):154–82.

Grace Parrish, MS, (gap2398@uncw.edu) is a Site Monitor on assignment to Pfizer Inc. for ICON Strategic Solutions. She earned her bachelor’s degree in biology from the University of North Carolina Wilmington, where she also conducted this research as part of her Capstone Project in Clinical Research and Development for her master’s degree.

Laurie A. Minns, PhD, (minnsl@uncw.edu) is an Assistant Professor of Clinical Research in the School of Nursing at the University of North Carolina Wilmington.
Appendix A: Survey Map
| # | Question | Possible Responses |
| Demographics | ||
| 1 | Age | (Text response)
Age <18 = end of survey |
| 2 | Gender | Man
Woman Transgender Non-binary Other Prefer not to say |
| 3 | Race/Ethnicity | American Indian or Alaskan Native
Asian / Pacific Islander Black or African American Hispanic White / Caucasian Other Prefer not to say |
| 4 | Location (City, State) | (Text response) |
| 5 | Are you currently a CRA? | Yes/No (No= end of survey) |
| 6 | Do you work at a CRO? | Yes/No (No= end of survey) |
| 7 | Highest level of education | High school or GED, associate degree, bachelor’s degree, graduate degree. |
| 8 | Work effort | Full-time, part-time |
| 9 | Previous research experience (years) prior to becoming a CRA | <1, 2, 3, 4, 5, 6, 7, 8, 9, >10 |
| 10 | Experience (years) as a CRA | <1, 2, 3, 4, 5, 6, 7, 8, 9, >10 |
| 11 | Annual monetary compensation (including any bonus pay) | (Text response)
|
| Financial Compensation | ||
| 12 | I feel my salary is adequate to the industry standard. | 1-Strongly Agree
2-Agree 3-Neither Agree nor Disagree 4-Disagree 5-Strongly Disagree |
| 13 | I feel my work is compensated. | 1-Strongly Agree
2-Agree 3-Neither Agree nor Disagree 4-Disagree 5-Strongly Disagree |
| 14 | When I think about my salary, I feel I am not adequately valued. | 5-Strongly Agree
4-Agree 3-Neither Agree nor Disagree 2-Disagree 1-Strongly Disagree (Reverse scored) |
| 15 | The benefits at my company are fair. | 1-Strongly Agree
2-Agree 3-Neither Agree nor Disagree 4-Disagree 5-Strongly Disagree |
| 16 | The salary system at my company motivates me to work hard. | 1-Strongly Agree
2-Agree 3-Neither Agree nor Disagree 4-Disagree 5-Strongly Disagree |
| 17 | I feel satisfied with my opportunity for a pay raise. | 1-Strongly Agree
2-Agree 3-Neither Agree nor Disagree 4-Disagree 5-Strongly Disagree |
| Perceived Workload | ||
| 18 | My job provides a work-life balance. | 1-Strongly Agree
2-Agree 3-Neither Agree nor Disagree 4-Disagree 5-Strongly Disagree |
| 19 | My work pressure limits me from activities I enjoy. | 5-Strongly Agree
4-Agree 3-Neither Agree nor Disagree 2-Disagree 1-Strongly Disagree (Reverse scored) |
| 20 | My workload often surpasses my capability. | 5-Strongly Agree
4-Agree 3-Neither Agree nor Disagree 2-Disagree 1-Strongly Disagree (Reverse scored) |
| 21 | My workload is manageable. | 1-Strongly Agree
2-Agree 3-Neither Agree nor Disagree 4-Disagree 5-Strongly Disagree |
| 22 | Pressures from my job limit me from doing my job to the best of my ability. | 5-Strongly Agree
4-Agree 3-Neither Agree nor Disagree 2-Disagree 1-Strongly Disagree (Reverse scored) |
| Career Development | ||
| 23 | I can improve my abilities through training programs offered within my company. | 1-Strongly Agree
2-Agree 3-Neither Agree nor Disagree 4-Disagree 5-Strongly Disagree |
| 24 | I feel satisfied with my promotion opportunity. | 1-Strongly Agree
2-Agree 3-Neither Agree nor Disagree 4-Disagree 5-Strongly Disagree |
| 25 | I can constantly gain new knowledge and experience through my work. | 1-Strongly Agree
2-Agree 3-Neither Agree nor Disagree 4-Disagree 5-Strongly Disagree |
| 26 | My company provides clear career development paths. | 1-Strongly Agree
2-Agree 3-Neither Agree nor Disagree 4-Disagree 5-Strongly Disagree |
| 27 | I feel my company provides adequate professional development. | 1-Strongly Agree
2-Agree 3-Neither Agree nor Disagree 4-Disagree 5-Strongly Disagree |
| Management | ||
| 28 | My manager is supportive. | 1-Strongly Agree
2-Agree 3-Neither Agree nor Disagree 4-Disagree 5-Strongly Disagree |
| 29 | My manager has my best interest in mind. | 1-Strongly Agree
2-Agree 3-Neither Agree nor Disagree 4-Disagree 5-Strongly Disagree |
| 30 | I enjoy my manager. | 1-Strongly Agree
2-Agree 3-Neither Agree nor Disagree 4-Disagree 5-Strongly Disagree |
| 31 | My manager is fair and considerate. | 1-Strongly Agree
2-Agree 3-Neither Agree nor Disagree 4-Disagree 5-Strongly Disagree |
| 32 | My manager pushes me to reach my career goals. | 1-Strongly Agree
2-Agree 3-Neither Agree nor Disagree 4-Disagree 5-Strongly Disagree |
| Turnover Intentions | ||
| 33 | I consider leaving my current company often. | 1-Strongly Agree
2-Agree 3-Neither Agree nor Disagree 4-Disagree 5-Strongly Disagree |
| 34 | I constantly want to quit my job. | 1-Strongly Agree
2-Agree 3-Neither Agree nor Disagree 4-Disagree 5-Strongly Disagree |
| 35 | I will try to look for a new job within the next year. | 1-Strongly Agree
2-Agree 3-Neither Agree nor Disagree 4-Disagree 5-Strongly Disagree |
| 36 | I do not think my prospects will be good if I remain at my current company. | 1-Strongly Agree
2-Agree 3-Neither Agree nor Disagree 4-Disagree 5-Strongly Disagree |